- Catalogs
- HGL Dynamics
- Interactive Analysis of Dynamic Data
Interactive Analysis of Dynamic Data

Interactive Analysis of Dynamic Data
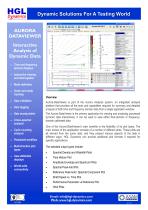
Overview
The Aurora-DataViewer is a component of the Aurora Analysis system, designed for interactive analysis of dynamic data in both time and frequency domains. It offers a single application window for comprehensive data analysis, providing flexibility in plot types and user-definable displays.
Key Features
- Interactive Analysis: Allows for time and frequency domain displays, interactive viewing, mode definition, order and mode tracking, data validation, tagging, and manipulation.
- Plot Types: Includes Spectral Density, Waterfall, Time History, Amplitude Envelope, Spectrum, Spectral Peak-hold, Reference Peak-hold, Shaft Speed vs. Time, Performance Parameter vs Reference, and Orbit Plots.
- Frequency Domain: Offers spectral ensemble diagrams, tracked order and mode lines, performance data, RMS data, and cross-spectral analysis.
- Time Domain: Provides sensor amplitude values, spectrum plots, 1/3 octave analysis, rainflow analysis, tacho cycle counting, stress lifing counter, and shaft centreline plots.
- User Configurable Displays: Users can create, save, edit, and load display templates for specific analysis tasks in both time and frequency domains.
- Workflow Persistency: Stores validation changes, annotations, and data manipulations to disk for shared access among users.
Contact Information
HGL Dynamics operates in the UK, Americas, and France, providing contact details for each region for further inquiries.
Catalog excerpts
AURORA DATAVIEWER Interactive Analysis of Dynamic Data • Time and frequency domain displays • Interactive viewing and interrogation • Mode definition • Order and mode tracking • Data validation • Data tagging • Data manipulation • Cross-spectral analysis • Cycle counting analysis • Persistent workflow • Multi-function plot types • User-definable displays • World-wide connectivity Dynamic Solutions For A Testing World Overview Aurora-DataViewer is part of the Aurora Analysis system, an integrated analysis platform that provides all the tools and capabilities required for summary and detailed analysis of both time and frequency domain data from a single application window. The Aurora-DataViewer is the primary application for viewing and analysing processed dynamic data interactively. It can be used to view either time-domain or frequency-domain calibrated data. One of the Aurora-DataViewer's main benefits is the flexibility of its plot types. The main screen of the application consists of a number of different plots. These plots are all derived from the same data, and they present various aspects of the data in different ways. HGL Dynamics can provide additional plot formats if required for specific applications. The standard output types include: • Spectral Density and Waterfall Plots • Time History Plot • Amplitude Envelope and Spectrum Plots • Spectral Peak-hold Plot • Reference Peak-hold / Spectral Component Plot • Shaft Speed vs. Time Plot • Performance Parameter vs Reference Plot Orbit Plots Email: [email protected] Web: www.hgl-dynamics.com
Open the catalog to page 1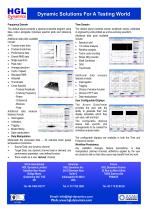
Dynamic Solutions For A Testing World Frequency Domain Time Domain The default layout presents a spectral ensemble diagram using false colour alongside individual spectral plots and reference plots. Additional data plots available The default layout presents sensor amplitude values, calibrated in engineering units plotted as a time-evolving waveform. include: • Tracked order lines • Tracked mode lines • Performance data • Overall RMS data • Single spectrum • Peak-hold • Average spectrum • Tacho / Speed • Resultant RMS • Waterfall • Thumbnails • Cross Spectral - Tracked Amplitude - Tracking Frequency -...
Open the catalog to page 2All HGL Dynamics catalogs and technical brochures
 Modal analysis software
5 Pages
 HERCULES
2 Pages
 AURORA DATAVIEWER
2 Pages


- Aeronautical software
- Real-time software
- Process software
- Maintenance software
- Test software
- Data acquisition unit
- Server software
- Data acquisition system for aerospace applications
- Data acquisition system without display
- Flight data recorder
- Aircraft flight data recorder
- Multi-channel data acquisition system
- Rugged data acquisition system
- Modular data acquisition system
- Portable data acquisition system
- Noise data acquisition system
- Digital data acquisition system
- 32-channel data acquisition system
- High-speed data acquisition system
- Speed data acquisition system